


Genomic insights of body plan transitions from bilateral to pentameral symmetry in Echinoderms
从基因组学去洞察棘皮动物躯体蓝图从双侧对称转变到五辐射对称
Abstract
Echinoderms are an exceptional group of bilaterians that develop pentameral adult symmetry from a bilaterally symmetric larva. However, the genetic basis in evolution and development of this unique transformation remains to be clarified. Here we report newly sequenced genomes, developmental transcriptomes, and proteomes of diverse echinoderms including the green sea urchin (L. variegatus), a sea cucumber (A. japonicus), and with particular emphasis on a sister group of tvhe earliest-diverged echinoderms, the feather star (A. japonica). We learned that the last common ancestor of echinoderms retained a well-organized Hox cluster reminiscent of the hemichordate, and had gene sets involved in endoskeleton development. Further, unlike in other animal groups, the most conserved developmental stages were not at the body plan establishing phase, and genes normally involved in bilaterality appear to function in pentameric axis development. These results enhance our understanding of the divergence of protostomes and deuterostomes almost 500 Mya.
棘皮动物是一类特殊的对称动物,幼虫两侧对称发育为成体则是五辐射对称。这种进化的遗传基础和独特的变态发育有待解释。在这里,我们报告了新测序的基因组、发育转录组和多种棘皮动物的蛋白质组,其中包括绿海胆( L. variegatus)、海参(A. japonicus)和一类早期的分支——海羽星(A. japonica)。我们获悉,棘皮动物最后的共同祖先,保留着和半索动物类似的有序的 Hox 基因簇,并且基因簇参与了内骨骼的发育。进一步的研究发现,棘皮动物不像其他动物群,其最保守的发育阶段并不是在躯体蓝图(body plan)构建时期,而涉及两侧对称的基因在五辐射对称的发育中可能发挥作用。通过这些研究结果更加肯定了——原口动物和后口动物产生分歧在差不多 500 万年前。
Introduction
Bilateral symmetry is highly conserved throughout animal evolution. Echinoderms, a group closely related to chordates, are exceptional in this regard, developing pentameral symmetry as adults from bilaterally symmetric larvae. Even sea cucumbers, which show worm-like bilateral structures as adults, retain pentameral symmetry patterning along their oral-aboral axis (Fig. 1a)1. Understanding the development of pentameral symmetry would provide important insight into the evolutionary mechanisms of major structural changes in evolution2,3. To probe the genetic and developmental transitions behind the evolution of these unique echinoderm features, we sequenced genomes of the green sea urchin (Lytechinus variegatus) and the feather star (Anneissia japonica), representing nearly 500 Mya of evolutionary history. We also added developmental transcriptomic datasets for other echinoderms (Supplementary Tables 1–22 and “Methods”), such as the sea cucumber (Apostichopus japonicus), and proteome analyses of feather star skeleton to broadly analyze five living echinoderm classes. These data provide fundamental genomic, transcriptomic, and proteomic insights of body plan evolution in echinoderms, and enhance our understanding of the divergence of protostomes and deuterostomes.
在整个动物进化过程中,两侧对称形式是高度保守的。但作为一个与脊索动物有着密切相关的棘皮动物,在这方面是例外的,其从两侧对称的幼虫发育成五辐射对称的成体。即使是海参,在成年时表现出类似蠕虫的两侧结构,也沿着它们的口-口轴保持着五辐射对称模式(图 1a)。了解五辐射对称的发展将为了解演化过程中主要结构变化的演化机制提供重要的信息。为探究这些独特的棘皮动物特征进化背后的遗传和发育转变,我们对绿海胆(Lytechinus variegatus)和海羽星 (Anneissia japonica)的基因组进行了测序,两者有近 5 亿年的进化史。我们还补充了其他棘皮动物的发育转录组的数据集(补充 表1-22 和 “方法”章节),比如海参(Apostichopus japonicus)和海羽星骨骼的蛋白质组,以此去分析现存的五种棘皮动物。这些数据为棘皮动物躯体蓝图进化的基因组学、转录组学和蛋白质组学提供了基础,并加深了我们对原口动物和后口动物差异的理解。
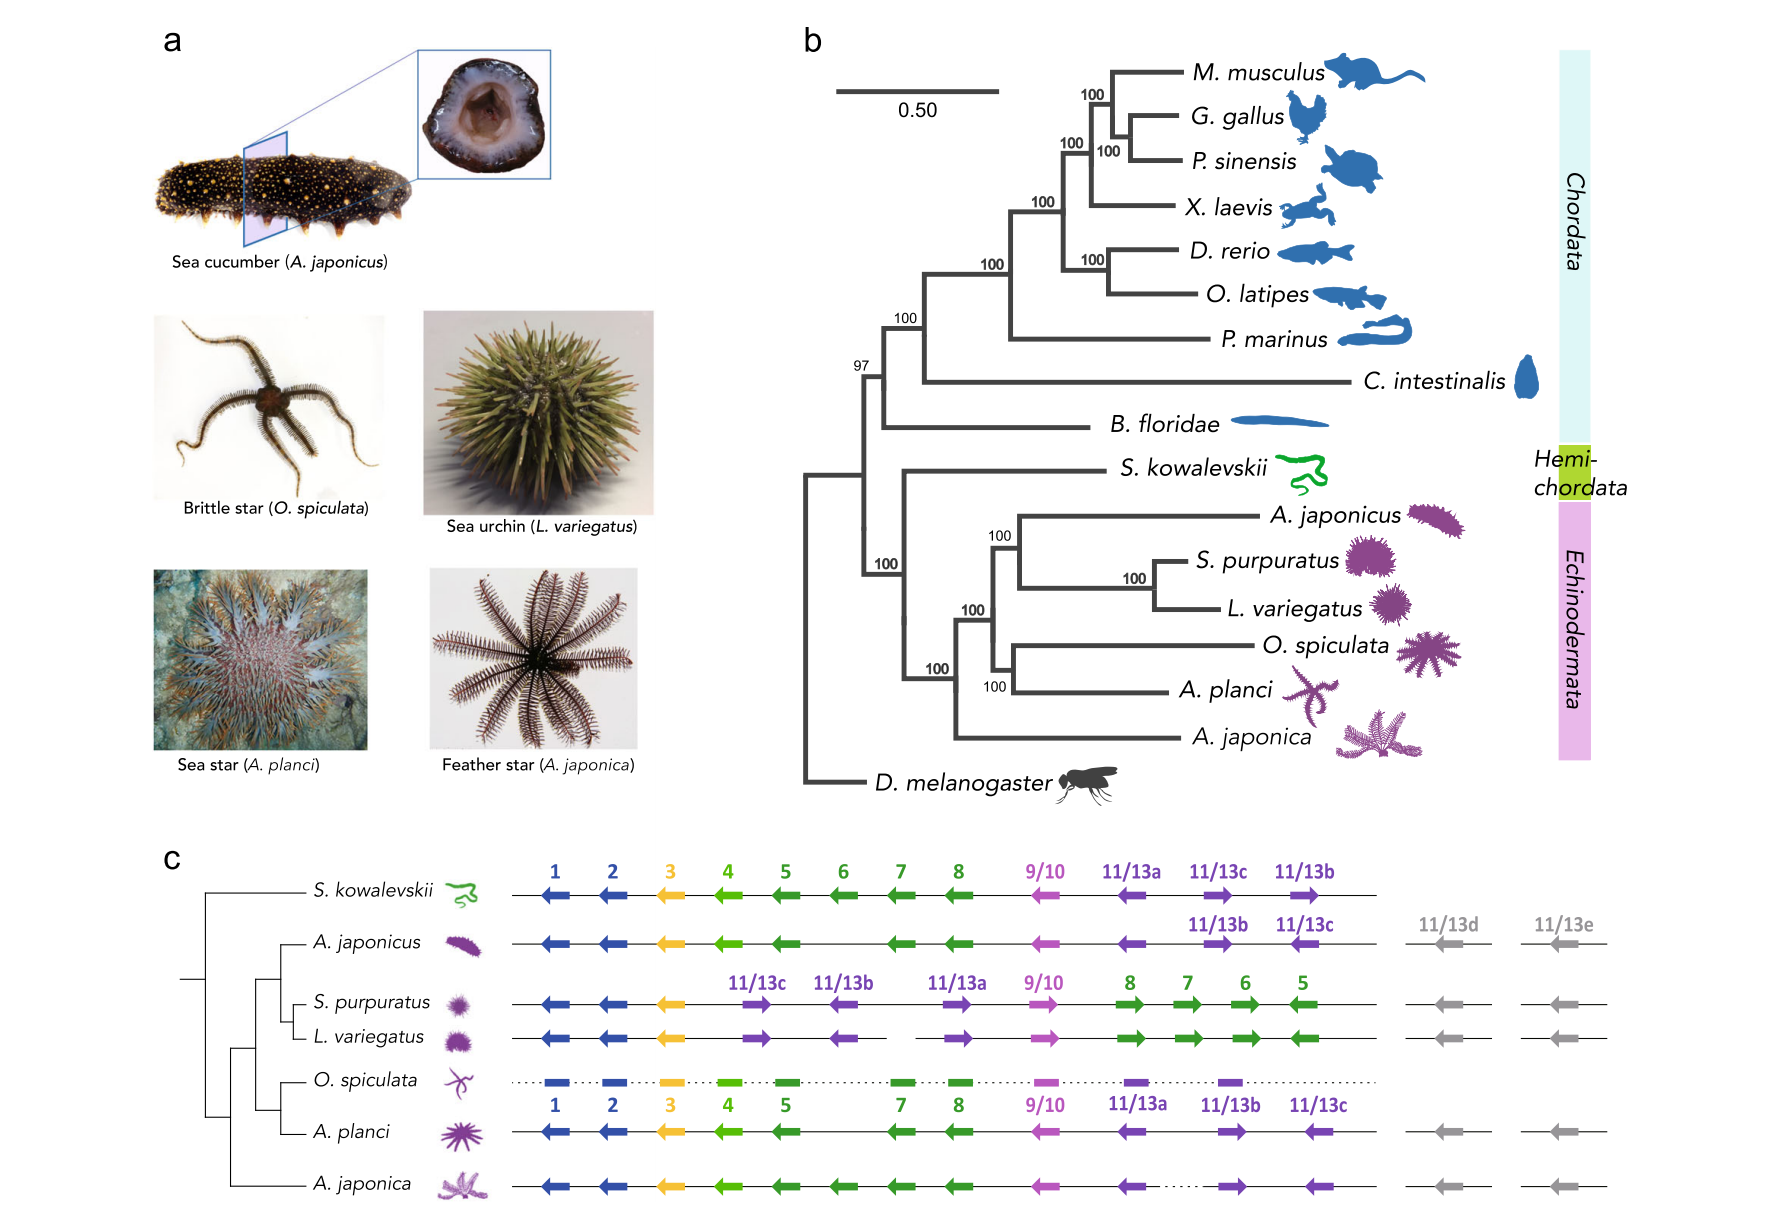
a Echinoderm species of five living classes were analyzed in this study. Pentameral symmetry can also be observed in the transverse section of the sea cucumber (top), which otherwise shows apparent bilaterality. b Evolutionary rate and the phylogenetic tree constructed by RAxML software using the 1196 orthologous protein sequences identified by reciprocal best blast hit (RBBH). The values on branches represent bootstrap values. c Schematic representation of genomic organization of ambulacrarian Hox clusters. Arrows and horizontal lines represent Hox genes and chromosomal DNAs, respectively. Dashed lines indicate the presence of unconnected scaffolds. See Supplementary Fig. 13 for more detailed Hox cluster structures. Hox cluster structures of S. kowalevskii 9, A. japonicus 56, S. purpuratus 7, O. spiculata 56 and A. planci 8 are according to the previous studies.
a 对5个现存纲的棘皮动物种类进行了分析。尽管海参是明显的两侧对称,但横切面(上)可以观察到五辐射对称。b 利用 RBBH (reciprocal best blast hit, RBBH)鉴定的 1196 条同源蛋白序列,利用 RAxML 软件构建进化速率和系统发育树。分支上的值表示自展支持率(bootstrap values)。c 步带动物的 Hox 基因组组织示意图:箭头和水平线分别代表 Hox 基因和染色体 DNA。虚线表示存在未连接的序列片段。Hox 簇结构详见补充图 13。S. kowalevskii. A. japonicus, S. purpuratus, O. spiculata 和 A. planci 的 Hox 簇结构均为前人研究所得。
Results
Genetic changes behind echinoderm evolution
棘皮动物进化背后的遗传变化
The estimated genome sizes were 952 Mb for green sea urchin and 553 Mb for the feather star (Supplementary Fig. 1), with 30,238 and 26,838 protein-coding genes, respectively (Supplementary Tables 18–20 and 23). Basic features of these genomes such as GC content, gene length, and exon number were comparable to those of chordate and hemichordate species (Supplementary Fig. 2–7). Genome-wide analysis with 1196 one-to-one orthologs (Fig. 1b, Supplementary Fig. 7, and Supplementary Table 23–24) robustly corroborated recent reports4,5 that Echinodermata consists of the early diverged Crinoidea (including feather star), Asterozoa (including brittle star and sea star), and Echinozoa (including sea urchin and sea cucumber). This is consistent with paleontological evidence that suggests echinoderms first evolved with a stemmed, or imperforate extra-axial morphology3. We also found that the overall protein sequences of an early diverged echinoderm species, the feather star, showed a relatively low evolutionary rate. Meanwhile, echinoderms showed only slightly diverged protein sequences from vertebrates, as opposed to an ascidian, a species with highly derived morphological features, and with significantly diverged genomic sequences from vertebrates (Supplementary Fig. 8 and Supplementary Tables 26–28).
估计绿海胆的基因组大小为 952 Mb 和 海羽星的基因组大小为 553 Mb (补充 图 1),分别有 30238 和 26838 个蛋白质编码基因(补充 表 18-20 和 23)。这些基因组的 GC 含量、基因长度和外显子数等基本特征与脊索类和半脊索类相似(补充 图 2-7)。通过全基因组分析得到 1196 条同源序列(图 1b,补充 图 7 和 表 23-24),有力地证实了最近的报道的棘皮动物门由早期独立分支出的海百合亚门(包括海羽星)、海星亚门(包括海蛇尾和海星)和海胆亚门(包括海胆和海参)组成。这与古生物学的证据相一致,棘皮动物首先进化出有茎或无轴的形态。我们还发现,棘皮动物的早期独立分支海羽星的整体蛋白质序列显示出相对较低的进化率。与此同时,在棘皮动物的基因组序列与脊椎动物的有较大差异的情况下,对比蛋白质序列棘皮动物的与脊椎动物的仅略有不同,而与形态结构与典型的脊索动物有很大差异海鞘(脊索动物)相反(补充 图 8 和 补充 表 26-28)。
Given that echinoderms evolved unique features without significant genome-wide changes detected, we tested abundance in sets of gene families that may have played critical roles in the evolution of the echinoderm features. We first tested if numbers of genes potentially involved in development (such as genes involved in cell-cell communications) have expanded in the common ancestor of echinoderms (Supplementary Fig. 10). In contrast to our expectation, GO term enrichment analysis suggested that no such terms were enriched in the echinoderm-expanded gene set (Supplementary Fig. 11). Rather, GO terms such as “cell communication”, or “signal transduction”, were present in echinoderm-contracted genes (Supplementary Fig. 11a). Further, genes potentially involved in cytoskeletal regulation appear to have experienced extensive modifications during echinoderm evolution. For example, the “plectin repeat domain”, one of the important domains of cytolinkers that connect cytoskeletal elements with each other and to junctional complexes6, was not found in any of the five echinoderm species (Supplementary Fig. 12). Similarly, genes potentially involved in actin cytoskeleton regulation such as BCAR1/CAS and PIP5K were found to be positively selected during echinoderm evolution (Supplementary Table 29), suggesting substantial modifications of cytoskeletal function during echinoderm evolution.
鉴于棘皮动物进化出了独特的特征,但没有检测到重大的全基因组变化,我们测试了大量可能在棘皮动物特征的进化中发挥关键作用的基因家族。我们首先测试了在棘皮动物的共同祖先中,其潜在参与发育的基因(比如参与细胞间通讯的基因)的数量是否已经增加(补充 图 10 )。但与我们的预期相反,通过 GO 术语富集分析(GO term enrichment analysis)表明,在棘皮动物扩展的基因集合中没有这样的术语(term)富集(补充 图 11)。但 GO 术语(GO term)例如“细胞通讯”或“信号传导”存在于棘皮动物的收缩基因(echinoderm-contracted genes)中。此外,可能参与细胞骨架调控的基因似乎在棘皮动物进化过程中经历了大量的修饰。例如,胶凝素重复结构域(plectin repeat domain)是将细胞骨架元素相互连接和连接复合体的细胞连接物的重要结构域之一,但在 5 种棘皮动物中均未发现。我们发现,在棘皮动物进化过程中BCAR1/CAS 和 PIP5K 等可能参与肌动蛋白细胞骨架调控的基因被正向选择了下来(补充 表 29),这表明在棘皮动物进化过程中细胞骨架功能发生了重大改变。
Hox clusters in ambulacrarians
步带类动物的 Hox 基因簇
步带类动物是由棘皮动物门与半索动物门组成的一类动物
We next analyzed genes in the Hox cluster, since previous studies implied that echinoderms may have undergone extensive changes to the genomic-arrangement of these genes early in their evolution7, but this is controversial8. By analyzing the echinoderm genomes, together with BAC sequencing and fluorescent in situ hybridization (FISH) experiments on feather star (see Supplementary Fig. 13), we found that A. japonica have 10 clustered Hox genes (Hox1 through Hox11/13a), together with two posterior genes (Hox11/13b and Hox11/13c) located with inverse directions more than 360 kb apart from the cluster of 10 Hox genes (Supplementary Fig. 14). This situation is reminiscent of hemichordate Hox gene clusters, which consist of 12 genes with the inversion/translocation of two posterior genes9. The consistent differences of Hox genes in feather star from those of hemichordates (Saccoglossus kowalevskii and Ptychodera flava9) were that the two posterior genes have face-to-face orientations, and two additional posterior genes (Hox11/13d and Hox11/13e) are present as reported in other echinoderm genomes10. These characteristics in turn suggest that the last common ancestor of echinoderms retained a canonical arrangement of 10 Hox genes, while its posterior genes had increased in number and changed their locations. This view accordingly indicates that the changes previously noted with the Hox gene clusters of echinoderms7,8, including the loss of Hox4 or Hox6 and the inversion/translocation of anterior genes, are lineage-specific events, and therefore are unlikely to be involved in the establishment of pentameral body plan. On the other hand, the involvement of the posterior Hox genes, are important candidates in the establishment of the pentameral body plan (Fig. 1c).
我们接下来分析了 Hox 基因簇中的基因,在此前的研究表明,棘皮动物在进化早期可能经历了大量的基因组排列的改变,但这一说法是有争议的。通过分析棘皮动物基因组,并结合海羽星 BAC 测序和荧光原位杂交(FISH)实验(见补充 图 13),我们发现 A. japonica 有 10 个聚合在一起的 Hox 基因簇(Hox1 到 Hox11/13a),以及 2 个在后部的距离这 10 个 Hox 基因簇位置超过 360 kb 的并且方向相对的基因(Hox11/13b 和 Hox11/13c)(补充图 14)。这种情况让人想起了半索动物的 Hox 基因簇,同样该基因簇由 12 个基因组成,其中 2 个在后部的基因有倒位或易位现象。海羽星与一些半索动物(Saccoglossus kowalevskii 和 Ptychodera flava)在后部的这 2 个 Hox 基因存在方向不一致的差异,并且有报道称,在棘皮动物基因组中还存在另外 2 个在后部的基因(Hox11/13d 和 Hox11/13e)。 种种迹象表明,棘皮动物的最后一个共同祖先保留了 10 个 Hox 基因簇的典型排列,在演化过程中其在后部的基因数量发生了增加并且它们的位置发生了改变。以上观点表明棘皮动物 Hox 基因簇的变化,包括 Hox4 、Hox6 和在前部的基因的倒位/易位,是特殊的世系事件,不太可能参与建立五辐射对称的躯体蓝图。同时说明,在后部的 Hox 基因是参与建立五辐射对称的躯体蓝图重要候选基因(图 1c)。
Echinoderm embryogenesis show hourglass-like conservation
棘皮动物胚胎发生呈保守沙漏形式
We next tested if evolution of echinoderm embryogenesis follows the developmental hourglass model11 as supported in several animal groups12,13,14,15,16. The phylotype hypothesis of the hourglass model predicts that anatomical features of most conserved-embryonic phase represent the body plan of their animal phylum11,17,18. We tested if the developmental stages most critical for the pentameral body plan show the highest transcriptomic conservation. Recent studies reported that the transcriptomic conservation is instead around blastula to gastrula in sea urchins19,20, however, these studies only examined embryonic sea urchins. We thus analyzed gene expression profiles by covering early-to-late embryos of four diverse echinoderm species, including the publicly available data of purple sea urchins21,22 and a sea cucumber23 (Supplementary Figs. 15 and 16). Unexpectedly, while the hourglass-like conservation was observed, the most conserved phase was not bracketing the pentameral establishing stages (defined as stages when first pentameral symmetric structures appear), but it was instead during gastrulation (Fig. 2a and Supplementary Figs. 17–18). This mismatch between the most conserved phase and the phase for establishing the body plan was also supported by pair-wise comparisons of one-to-one orthologs (Supplementary Fig. 19). These results suggested that, unlike in other animal groups such as vertebrates, the phase for establishing the body plan in echinoderms has experienced substantial diversification during their evolution, further implying that the phylotype hypothesis may not fit within echinoderm embryogenesis. However, a potential caveat of this conclusion would be that the conservation signals from adult rudiments could have been obscured by larval tissues, as adult rudiments share only a small proportion of embryo in early metamorphic stages. Similar analyses with dissected adult rudiment, or single-cell RNAseq technology could clarify this point. While possible contribution of pleiotropic constraints were supported between the closely related species as reported previously24,25 (Supplementary Figs. 20 and 21), further studies are needed to clarify the evolutionary mechanism behind the unique evolution of echinoderm embryos.
我们接下来试验棘皮动物胚胎发生的进化是否遵循发育沙漏模型,该模型已被几个动物群体验证支持。系统发育假说(the phylotype hypothesis)的沙漏模型预测出的动物躯体蓝图特征会在解剖学中最保守胚胎时期的表现出来。我们对构建五辐射对称的躯体蓝图最关键的发育阶段进行实验,检测这些时期转录组是否会高度保守。最近研究报道,海胆的从囊胚到原肠胚转录组是保守的,然而,这些研究只检测了海胆胚胎。因此,我们分析了包括公开数据的紫海胆和海参在内的 4 种不同棘皮动物从早期至晚期胚胎的基因表达谱。出乎意料的是,虽然观察到沙漏样保守,但最保守的阶段并不是五辐射对称建立阶段(定义为五辐射对称结构首先出现的阶段),而是在原肠胚形成的阶段(图 2a 和补充图 17 ~ 18)。这种最保守的时期和建立躯体蓝图的时期之间的不匹配也被一对一的同源序列的配对比较所支持(补充图 19)。这些结果表明,与脊椎动物等其他动物不同,棘皮动物的躯体蓝图建立阶段在进化过程中经历了大量的变化,进一步表明系统发育假说可能不适用于棘皮动物胚胎发生。然而,这一结论的一个潜在提示是,来自成体雏形的保守信号可能被幼虫组织所掩盖,因为成体雏形只占早期变态阶段的胚胎的一小部分。用解剖的成体雏形或单细胞 RNAseq 技术进行类似的分析可以阐明这一点。虽然先前报道的近亲缘物种之间可能存在多向性限制(补充图 20 和 21),但需要进一步的研究来阐明棘皮动物胚胎独特进化背后的机制。
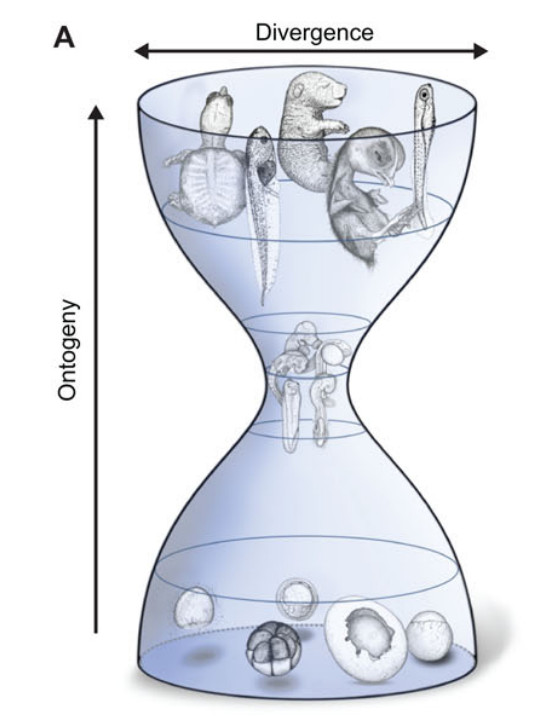
图引自 The developmental hourglass model: a predictor of the basic body plan? doi:10.1242/dev.107318 用于理解胚胎沙漏,与原文无关
Partial co-option in pentameral body plan establishment
局部选配在五辐射对称的躯体蓝图建立
Paleontological studies suggested the possible evolution of pentameral body axes through changes in the mechanisms of bilateral symmetry26 (Fig. 2b). However, developmental genes that control the pentameral symmetry remains largely unknown. We thus focused on genes that are involved in Left/Right-patterning and other axis-forming in bilaterians27,28,29,30,31 and examined expression patterns of their homologs in the feather star, particularly at the attachment and cystidean stages when the pentameral body plan forms (Supplementary Figs. 22 and 23). Among the genes examined, pitx exhibited relatively strong expression in the calyx, where the pentameral structure first becomes evident (Fig. 2c–d,). Weak expression of chordin was also detected in the calyx (Supplementary Fig. 23). Meanwhile, expression of bmp2/4, nodal, lefty and not were detected most during gastrula to doliolaria stages (Supplementary Fig. 22), but not in the calyx (Supplementary Fig. 23), implying that these genes are possibly involved in the body patterning during bilateral planktonic development rather than pentameral body plan development. These results suggest that evolution of the pentameral body plan may have associated partial co-option of genes involved in existing body axes, which in part, coincides with paleontological predictions that modification of bilateral patterning system contributed to the pentameral body plan establishment26.
古生物学研究表明,五辐射对称可能是通过两侧对称机制的进化的而来。然而,控制五辐射对称的发育基因在很大程度上仍然未知。因此,我们把重点放在了涉及两侧对称动物左/右模式和其他轴形成的基因上,并研究了它们在海羽星中的同源基因的表达模式,特别是在五辐射对称形成时的附着和囊状体阶段(补充图 22 及 23)。在检测的基因中,pitx 基因在五边形结构首先变得明显的杯状结构中表达较强(图 2c ~ d)。在杯状结构中也检测到微弱的 chordin 表达(补充图 23)。同时,bmp2/4、nodal、lefty 和 not 的表达在原肠胚到桶形幼虫阶段最多(补充图22),但在杯状结构中不表达(补充图 23),这意味着这些基因可能参与了两侧浮游生物体型的发育,而不是五辐射体型的发育。这些结果表明,五辐射躯体蓝图的进化可能与参与现有体轴的部分基因共同选择有关,这在一定程度上与古生物学的预测一致,即两侧模式系统的修改有助于五辐射躯体蓝图的建立。
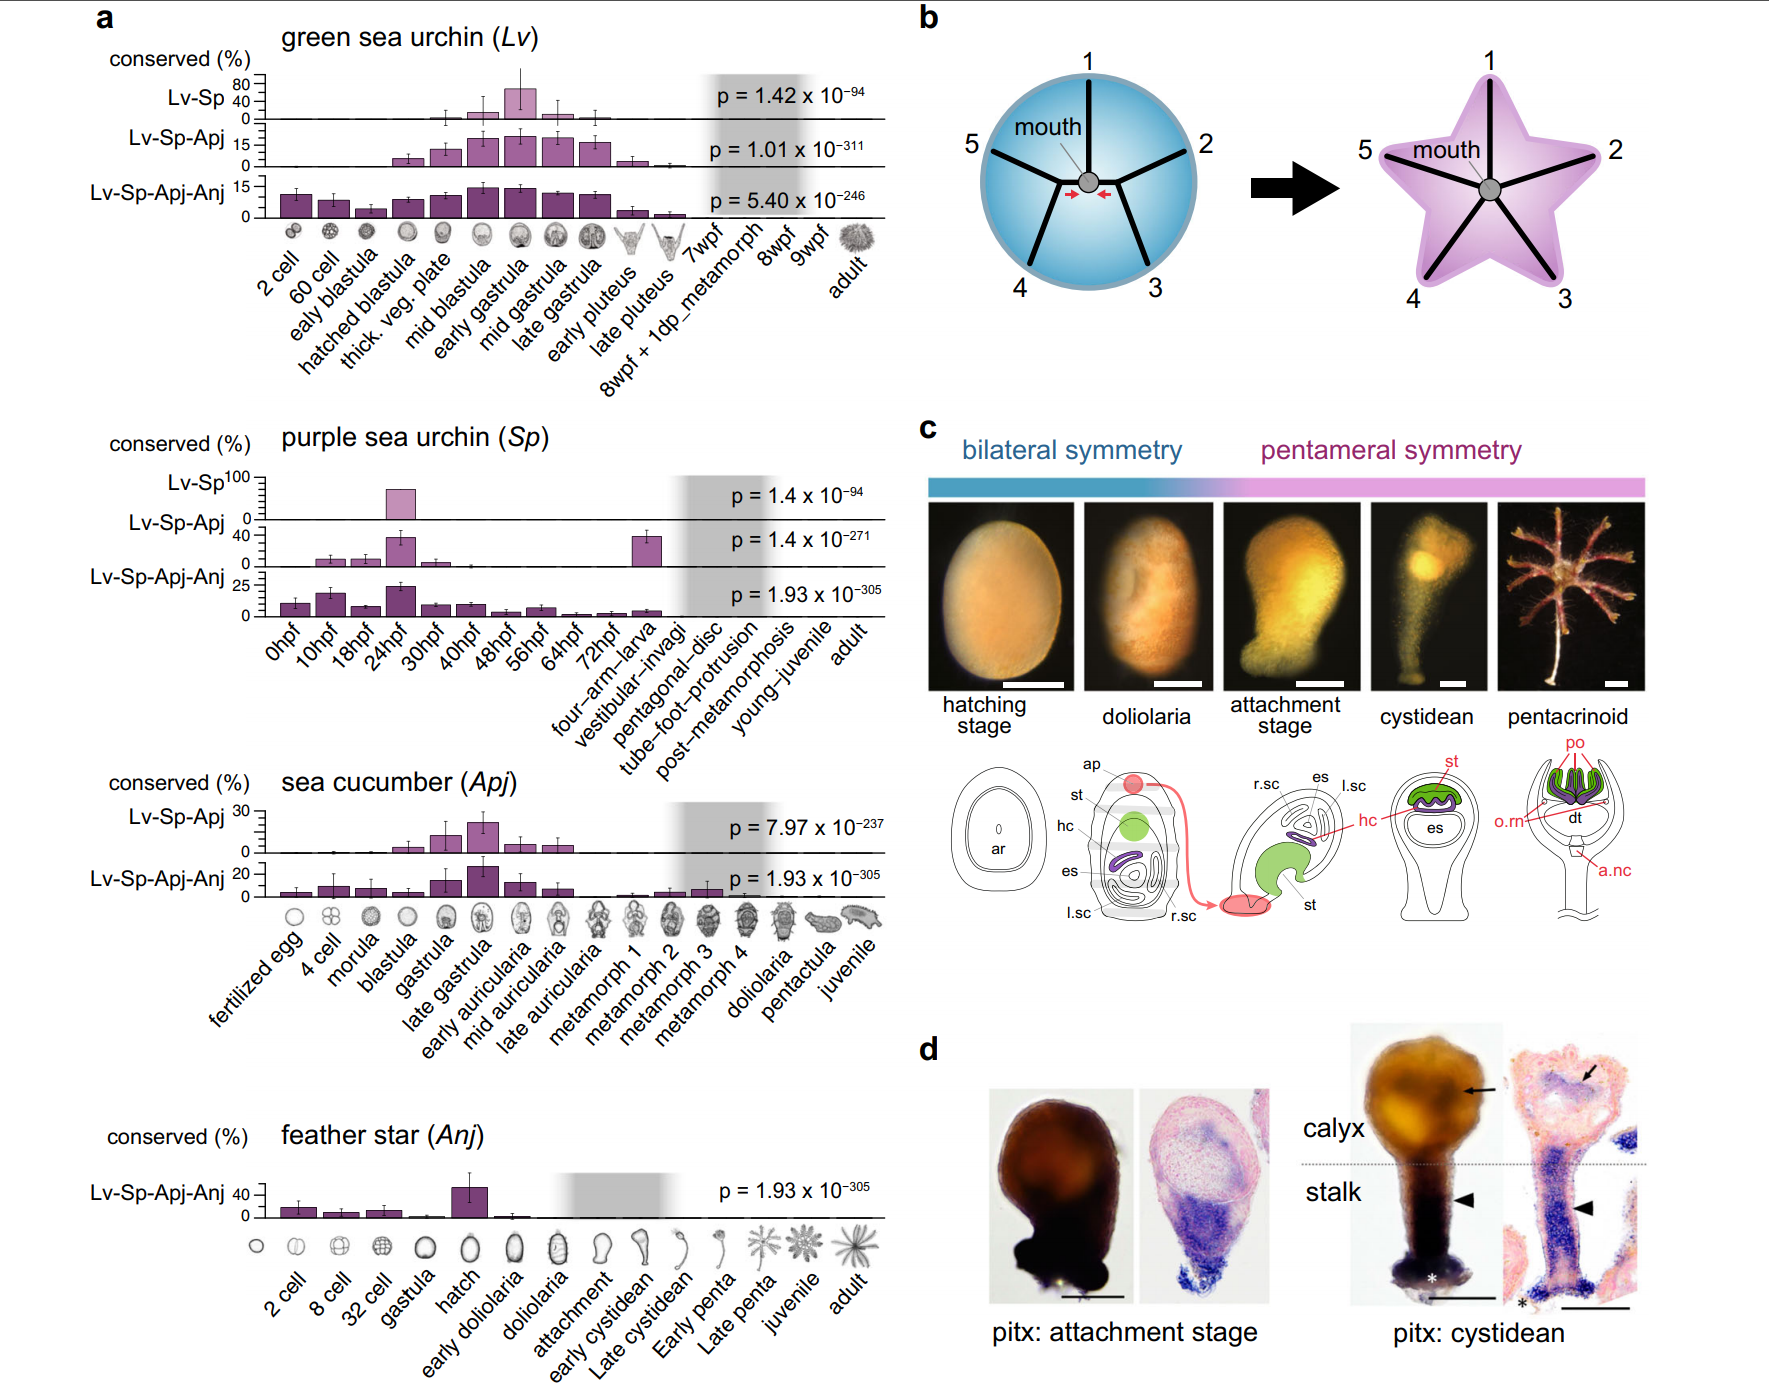
a Mid-embryonic conservation found in echinoderm species. Based on expression distance (expDists, see also Supplementary Fig. 17) of orthologous groups (defined by orthomcl57), an evolutionary conservation of developmental stages were estimated for three taxonomic levels (Lv-Sp, Lv-Sp-Apj, Lv-Sp-Apj-Anj, see also “methods”). The vertical axis represents percentages of the stage being included in the most (top 1%) conserved stage-combinations13 (Ptop). Changes of the Ptop scores were significant among stages (Friedman test). Error bars represent S.D. of Ptop values. In each species, the developmental phase in which pentameral body plan establishment begins is colored in gray. b Possible evolutionary transition from bilateral symmetry to pentameral symmetric body plan suggested by paleontological studies61. The basal echinoderms had a bilaterally symmetric ambulacral system that is arranged in a 2–1–2 pattern (left); consisting of one unpaired ambulacrum (1) and two ambulacra with a distal bifurcation (2&3, 4&5) and a single unpaired ambulacrum (1). c Feather star development from bilateral symmetry to pentameral symmetry. a.nc aboral nerve center, ar archenteron, ap adhesive pit, dt digestive tract, es enteric sac, hc hydrocoel, l.sc left somatocoel, o.rn oral ring nerve, po podia, r.sc right somatocoel, st stomodeum. d pitx gene expression detected in embryos of attachment stage and cystidean stage. In cystidean embryos, pitx was expressed in the tissues around the gut (arrows) and the inner tissue of the whole stalk (arrowheads). Scale bars: 100 μm. The expression was detected by in situ hybridization with whole mount (left) and sectioned specimens (right).
a 在棘皮动物物种中发现的胚胎中期保守。基于直系同源基因簇(由 orthomcl 定义)的表达距离(expDists,见补充图 17),对 3 个分类水平(Lv-Sp, Lv-Sp-Apj, Lv-Sp-Apj-Anj,见“methods”)的发育阶段的进化保守性进行了估计。纵轴表示包含在最保守阶段(top 1%)中的阶段百分比(Ptop)。Ptop 得分在各阶段间变化显著(Friedman检验)。误差棒表示 Ptop 值的标准差。在每个物种中,建立五辐射对称躯体蓝图开始的发育阶段用灰色表示。b 古生物学研究表明,可能从两侧对称进化到五辐射对称躯体蓝图。基本的棘皮动物具有两侧对称的步带系统,步带系统按 2-1-2 模式排列(左);由一个不配对的布带(1)和两个具有远端分叉的步带(2&3,4&5)和一个单一的不配对的步带(1)组成。c 海羽星由两侧对称向五辐射对称发展。a.nc 口神经中枢,ar 原肠,ap 粘连窝,dt 消化道,es 肠囊,hc 积液腔,l.sc 左体腔,o.rn 口环神经,po 足,r.sc 右体腔,st 口腔。d pitx 基因在附着期(attachment stage)和囊体期(cystidean stage)胚胎中的表达。在囊体期胚胎中,pitx 在肠道周围组织(箭头)和整个茎的内部组织(箭头)中表达。比例尺:100 μm。左为整体装片,右为切片标本,采用原位杂交法检测表达。
Proteome analyses of echinoderm skeleton
棘皮动物骨骼的蛋白质组分析
Mineralized endoskeleton is another notable feature of echinoderms. Despite the widely conserved endoskeleton structures in echinoderms, some of the proteins first identified in sea urchin biomineralization, such as MSP130, have not been identified in the skeleton of other echinoderm species. The MSP130 gene was suggested to have originated in prokaryotes and was introduced into metazoan genomes, including echinoderms, by horizontal gene transfer32. An MSP130-like gene involved in biomineralization has also been identified in a polychaete33. The authors suggest that the MSP130 gene was present in the common ancestor to bilaterians, rather than being introduced into protostomes and deuterostomes in separate lateral transfer events. The MSP130 protein was then co-opted into skeleton formation at some point in echinoderm evolution. The gene was duplicated in sea urchins and the resulting paralogues acquired repetitive regions32. The MSP130 gene is present in other echinoderm genomes, but is not utilized in the proteome of brittle stars34,35 or sea stars36. Here, we performed a proteome analysis and identified 280 proteins that are included within the mineral of the adult feather star skeleton (see “Methods”). These skeletal proteins included a protein similar to the urchin MSP130 proteins, suggesting that the ancestral echinoderm had co-opted this single protein into biomineralization (Supplementary Fig. 24). A number of other genes encoding skeletal proteins and domains conserved between the purple sea urchin (S. purpuratus) and the feather star were also identified (Fig. 3). Among these, we found two proteins with C-type lectin domains, which are also found on the urchin spicule matrix proteins. C-type lectin proteins are absent in sea star skeletons36, and present in only a few copies in brittle star skeletons34,35. Sea urchin skeletons utilize a large number of C-type lectins, mostly with repetitive stretches of acidic amino acids37, while the feather star and brittle star proteins lack these repetitive domains (Supplementary Fig. 25). A possible evolutionary scenario to explain these differences is that the ancestral skeletal C-type lectin genes experienced extensive duplication and acquisition of repetitive domains in the sea urchin lineage. The use of C-type lectins in the sea star skeleton was lost, while the C-type lectins in the feather star and brittle star skeletal proteomes remain largely unchanged. Together, these results suggest that the precursors to all of the genes and domains used in echinoderm skeleton were already present in the common ancestor to echinoderms, which emerged 589.7 Mya (Supplementary Fig. 7). Additionally, these skeleton-related genes may have undergone frequent duplication and loss in specific lineages, together with frequent changes in gene expression, since expression of MSP130-like genes and C-type lectin genes in the skeleton forming cells were lost in some lineages, even though these genes exist in their genomes. In summary, our study highlights the genomic, transcriptomic and proteomic changes behind the evolution of unique features in echinoderms, and offers an exceptional case in understanding the general tendency for the evolution of body plans.
内骨骼矿化是棘皮动物的另一个显著特征。尽管棘皮动物的内骨骼结构十分保守,但一些的蛋白质最早被鉴定是在矿化海胆中,如 MSP130,尚未在其他棘皮动物的骨骼中发现。MSP130 基因被认为起源于原核生物,并通过水平基因转移引入包括棘皮动物在内的后生动物的基因组。一个涉及生物矿化的类似 MSP130 基因(MSP130-like gene)也在多毛纲动物中被鉴定出来。作者认为,MSP130 基因存在于两侧动物的共同祖先中,而不是在单独的水平转移中被引入到原口动物和后口动物中。在棘皮动物进化的某个阶段,MSP130 蛋白参与了骨骼的形成。该基因在海胆中发生重复,由此导致旁系同源基因获得重复域。MSP130 基因存在于其他棘皮动物基因组中,但在海蛇尾和海星的蛋白质组中没有表达。在这里,我们进行了蛋白质组分析,并鉴定了包括成体海羽星骨骼的矿物质在内的 280 个蛋白质(见方法)。这些骨骼蛋白中包含一种类似于海胆 MSP130 蛋白的蛋白质,这表明棘皮动物的祖先利用了这一个蛋白质进行生物矿化(补充图 24)。此外,还发现了一些其他的基因,这些基因编码了紫色海胆(S. purpuratus)和海羽星之间的骨骼蛋白和保守域。其中,我们发现了两个具有 C 型凝集素结构域(C-type lectin domains)的蛋白,它们也存在于海胆骨针基质蛋白(spicule matrix proteins)上。C 型凝集素蛋白在海星骨骼中不存在,而在海羽星的骨骼中仅存在少数拷贝。海胆骨骼利用了大量的 C 型凝集素,且大多数是酸性氨基酸的重复延伸,而海羽星和海蛇尾蛋白缺乏这些重复的结构域(补充图 25)。一个可能的进化方案,用来解释这些差异是在海胆谱系中,祖先的骨骼 C 型凝集素基因经历了重复并且获得了重复结构域。海星骨骼中 C 型凝集素消失了,而海羽星和海蛇尾骨骼蛋白质组中的 C 型凝集素基本保持不变。结合这些结果表明,棘皮动物骨骼中使用的所有基因和结构域的前体已经存在于 589.7 百万年前棘皮动物的共同祖先中。此外,这些与骨骼相关基因可能在特定谱系中发生频繁的重复和丢失,以及基因表达发生的频繁变化,因为在某些谱系中,在骨架形成的细胞中即使类似 MSP130 基因和 C 型凝集素基因存在于它们的基因组中,但它们不表达。综上所述,我们的研究突出了棘皮动物独特特征进化背后的基因组、转录组和蛋白质组的变化,并为理解躯体蓝图进化的一般趋势提供了一个案例。
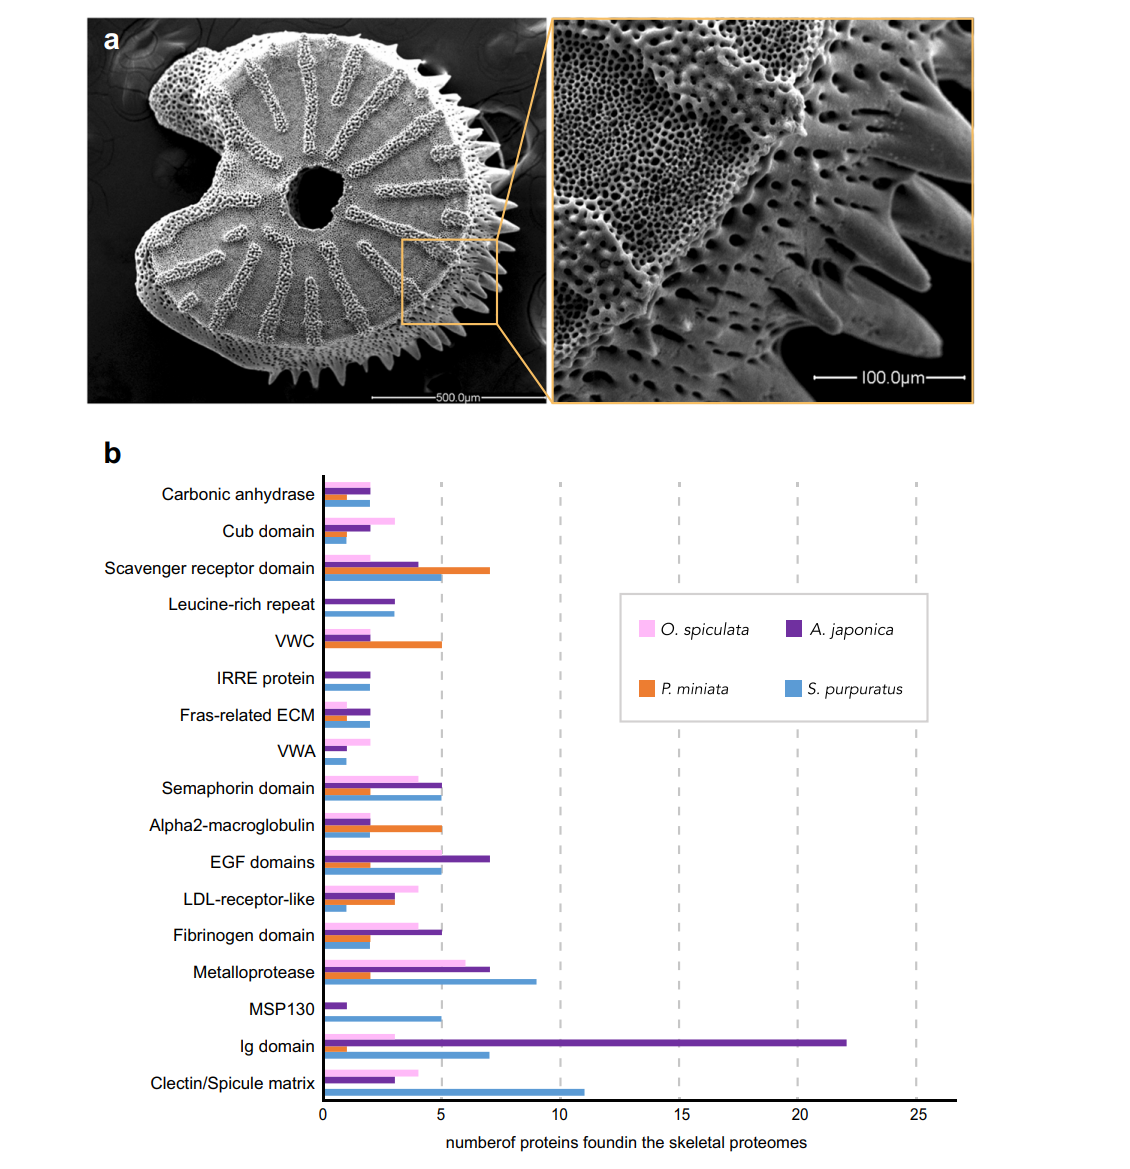
a SEM image of a skeletal element isolated from the feather star (A. japonica). b Proteins present in the feather star skeletal proteome were isolated from adult skeleton and identified by comparison of LC/MS/MS data to the genes computationally identified in the feather star genome. These proteins were compared to those found in skeletal proteomes of the sea urchin S. purpuratus 62,63,64, the sea star P. miniata 36 and the brittle star O. spicullata 35. The most prevalent proteins are shown in the figure, along with the number of different proteins from the listed groups present in each species’ proteome. The feather star skeletal proteome contains members of each of the protein families shown. The other echinoderm species are missing some of these proteins in their skeletal proteome and the number of members in each protein family varies between groups.
a 从海羽星(A. japonica)分离出来的骨骼元素的扫描电镜图像。b 从海羽星成体骨骼中分离出的骨骼蛋白质组,并通过 LC/MS/MS 数据与海羽星基因组中计算鉴定的基因进行了鉴定。将这些蛋白质与海胆(S. purpuratus)、海星(P. miniata)和海蛇尾(O. spicullata)的骨骼蛋白质组中的蛋白质进行了比较。图中显示了最常见的蛋白质,每个物种有不同数量的蛋白质组。海羽星的骨骼蛋白质组涵盖了所展示的所有蛋白质家族的成员。其他棘皮动物的骨骼蛋白质组中或多或少缺少的部分蛋白质,每个蛋白质家族成员的数量不相同。
Methods
Animal care and use
Animal care and experimental procedures and were conducted in strict accordance with guidelines approved by the Animal Experiments Committee of University of Tokyo (approval ID: 14–03, 16–2). All efforts were made to minimize suffering. Individual animals and embryos were selected blindly from wild types.
DNA extraction, library construction, and genome sequencing
Lytechinus variegatus: Genomic DNA was extracted from sperms from a single male. We first constructed five different short-insert libraries (394, 424, 479, 496, and 522 bp. See also Supplementary Table 1) from the genomic DNA samples and sequenced them using the Illumina HiSeq 4000 system to survey the genome complexity. After obtaining the genome size, we further constructed four mate-pair libraries (2–18 Kb. See also Supplementary Table 1) from the same DNA sample, and sequenced them for further assembly. The DNA and genome we obtained in this project is independent from those available through EchinoBase (Lytechinus variegatus genome v.2.2).
Anneissia japonica: After collecting adult feather stars in the cove of Koajiro, Sagami Bay (Misaki, Japan) by scuba diving, sperms from a single male was collected during the breeding season when the gonads were ripe with mature gametes. Sperms were embedded in ~0.5% low-melting agarose plugs (SeaPlaque GTG Agarose, Lonza), and in-gel digestion of proteins was performed by immersing the plugs in digestion buffer (10 mM Tris-Cl pH 7.5, 50 mM NaCl, 10 mM EDTA, 0.5% SDS, 200 mg/mL Proteinase K) at 55 °C, overnight. The gel-plugs were washed repeatedly with TE buffer and stored in TE at 4 °C until use. DNA was released from the gel-plugs using GELase (Epicenter). The DNA was further purified using QIAGEN Genomic-tip 20/G (QIAGEN) and dissolved in TE. Five different short-insert libraries (277, 324, 381, 450, and 477 bp) were constructed and sequenced with Illumina HiSeq 4000 system to survey the genome complexity. After obtaining the genome size, we further constructed six mate-pair libraries (2–18 Kb) and sequenced them for further assembly (Supplementary Table 1).
K-mer-based estimation of genome sizes
We first compared the performances in genome size estimation by K-mer frequency method and GenomeScope. The genome size of green sea urchin estimated by GenomeScope was about 650 Mbp, while that of kmerfreq method was about 952 Mbp. Considering that the genome size estimated by kmerfreq was closer to the genome size estimated from C-value (0.92, www.genomesize.com) than GenomeScope, we decided to apply kmerfreq method for the genome size estimation. Following formula was used for estimating genome size: Genome size (bp) = K-mer number/average depth of K-mer. Based on the rate of occurrence of K-mers in each genome, the read depths for feather star and green sea urchin were estimated as 147 and 124, respectively, leading to genome size estimations of approximately 553 Mb for feather star and 952 Mb for green sea urchin (Supplementary Fig. 1).
Raw read filtering and error correction of short-read libraries
HiSeq raw reads with the following features were regarded as low-quality reads and were filtered out: [1] Reads containing >10 bp adapter sequences; [2] Reads in the small insert libraries (refer to Supplementary Tables 1 and 2) having >10 bp overlap; [3] Reads having N’s >10% of their length; [4] PCR duplicates (paired-end reads completely identical); [5] Reads containing >40 bp low-quality (phred quality score ≤ 5) bases. After the filtering process, we further corrected the qualified K-mers. In brief, K-mers with sequencing errors are usually low in frequency, and we thus corrected these K-mer sequences by refering to high-frequent reads. If the erroneous sites could not be corrected, the low-frequency K-mers from the reads were trimmed. No error correction was made for the long-insert libraries (refer to Supplementary Tables 1 and 2), as these were only used for scaffolding. The SOAPec_bin_v2.03 software was used to correct the error within reads. Command line: SOAPec_bin_v2.03/bin/KmerFreq_AR -q 33 -b 100000000000 -k 17 -p output reads_files_list; SOAPec_bin_v2.03/bin/Corrector_AR -Q 33 -k 17 output.freq.cz output.freq.cz.len reads_files_list.
Gene set and genomes obtained from public database
Refer to Supplementary Table 24 for the publicly available gene set and genomes used in this project.
Genome assembly
Genome sequences with the filtered and/or corrected data were assembled by Platanus software. The assembly was carried out using the following steps: (a) Contig construction: Reads from short-insert (<1 Kb) libraries were split into K-mers and used to construct a de Bruijn graph. Short branches caused by errors were removed by “tip removal” step and short repeats were resolved by K-mer extension. Bubble structures caused by heterozygosity or errors were removed. At last, subgraphs without any junctions represent the contigs. (b) Scaffold construction: All the filtered clean reads were re-aligned onto the contig sequences, and the scaffolds were constructed by weighting the consistent rate and paired-end reads relationships on the contigs. Heterozygous regions were removed as bubble or branch structures on the graph by the “bubble removal” or “branch cut” step. These simplification steps are characteristic of Platanus and especially effective for assembling complex heterozygous regions. © Gap filling: Paired-end reads have one end mapped on the contig with the other end located in the gap region were used to fill the gaps in the genome assembly by GapCloser1.10 software. Then the very short assembly sequences (contig shorter than 500 bp) were removed in the genome assembly. The detailed command lines of the Platanus assembly were shown as below: Feather star: platanus assemble -o contig.fa -f short_clean_reads.fq -k 69 -u 0.2 -m 200; platanus scaffold -c contig.fa -b contigBubble.fa -o scaffold.fa -IP R1.fq R2.fq -OP R1.fq R2.fq -u 0.2. Green sea urchin: platanus assemble -o contig.fa -f short_clean_reads.fq -k 29 -u 0.3 -m 200; platanus scaffold -c contig.fa -b contigBubble.fa -o scaffold.fa -IP R1.fq R2.fq -OP R1.fq R2.fq -u 0.3. Results by K-mer analysis Supplementary Fig. 1, and statististics of feather star and green sea urchin genomes are shown in Supplementary Tables 3 and 4.
Assessment of assembled genomes
The completeness of the feather star and green sea urchin assemblies was assessed by the BUSCO program (version 2.0), using the eukaryotic and metazoan libraries (Supplementary Tables 6–8). Reads from the short-inserts libraries were also mapped to these assembled genomes by BWA and SAMtools software (bwa index -a bwtsw genome.fa; bwa aln -t 6 genome.fa reads.fq; samtools view -b -S out.sam > out.bam; samtools flagstat out.bam) to assess the genomic quality (Supplementary Table 9). In addition, coverage ratio of de novo assembled transcripts obtained by Trinity <ver. 2.2.0 > (perl Trinity --JM 200 G --seqType fq --left reads_R1.fq --right reads_R2.fq --SS_lib_type FR -output out) and TGICL software (tgicl -F transcripts.fasta) over the sequenced genomes using BLAT software (blat genome.fa transcript.fa -t = dna -q = rna out.psl) (Supplementary Tables 10–13. De novo assembled the transcripts (made by the RNAseq data we obtained for each species) were also aligned to the fileterd genome and confirmed that 98.64% transcripts in feather star and 99.53% transcripts in green sea urchin were aligned.
GC content of genome
GC content of the feather star and green sea urchin genomes were estimated using a sliding window approach. Briefly, a 500 bp sliding window (250 bp stepwise) was employed to scan along the genome and calculate the GC content, and found that the average GC content of feather star and green sea urchin is about 33.22% and 33.71%, respectively. Both of these values were found to be similar with those of hemichordate and most chordate species except lamprey (Supplementary Fig. 2).
Repeat annotation
Tandem repeats in the genomes were identified using Tandem Repeat Finder38 (v4.04 http://tandem.bu.edu/trf/trf.html) with default parameters (trf sequence.txt 2 7 7 80 10 50 2000 -d -h, these number means: Match, Mismatch, Delta, PM, PI, Minscore, and MaxPeriod), and non-interspersed repeats in the genome using RepeatMasker38 (open-4–0–5) with default parameters (-nolow (Not mask low_complexity DNA or simple repeats) -no_is (Skips bacterial insertion element check) -norna (Does not mask small RNA (pseudo) genes) -parallel 1 (The number of processors to use in parallel)). Transposable elements (TEs) were identified on both the DNA and protein levels. On the DNA level, RepeatModeler (v1.0.4) and RepeatScout39 (version 1.0.5) was used to build repeat libraries. In feather star, LTR_FINDER40 (v1.0.5) software were additionally used to build de novo repeat libraries. RepeatMasker was performed on both de novo libraries and repbase (RepBase16.02) separately to identify homologous repeats with default parameters with format set with 2 (-w 2-table). On the protein level, RM-BLASTX within RepeatProteinMask was used to query the TE protein database with -noLowSimple and P-value 0.0001 (Supplementary Fig. 3 and Supplementary Tables 14–17).
Prediction of protein-coding genes
Prediction of protein-coding genes was based on integration of three different methods, namely, ab initio prediction, homology-based annotation and RNAseq-based annotation. For ab initio prediction, Augustus41 (v2.5.5, --uniqueGeneId=true [output gene identifyers] --noInFrameStop=true [Do not report transcripts with in-frame stop codons] --gff3=on [output in gff3 format] —strand=both [–strand=forward and --strand=backward]) and GENSCAN42,43 (v1.0, -mini_cds 150 -cds_ns 10) software were used to predict genes. In feather star, SNAP44 (using ** species for gene prediction) and GlimmerHMM45 (v3.02, using ** species for gene prediction, and -f [Do not make partial gene predictions] -g [Print output in gff format]) softwares were also used in this analysis. These four software programs were trained by using lamprey, human, ciona, and zebrafish, respectively. Short genes (CDS length < 150 bp) and low-quality genes (gaps covered more than 10% of the coding region) were discarded. Proteins from human (Ensembl:GRCh38), mouse (Ensembl: GRCm38), chicken (Ensembl: Gallus_gallus-5.0), green anole lizard (Ensembl: AnoCar2.0), Xenopus tropicalis (Ensembl: JGI_4.2), zebrafish (Ensembl: GRCz10), sea lamprey (Ensembl: Pmarinus_7.0), lancelet (LanceletDB: v18h27.r3_ref), Ciona instestinalis (NCBI: GCA_000224145.1), acorn worm (NCBI: GCF_000003605.2) and purple sea urchin (NCBI: GCF_000002235.4) were used in the homology-based annotation using tblastn with e-value 1e-5. Blast hits that correspond to reference proteins were concatenated by Solar software and low-quality records were filtered out. Sequence of each reference protein was extended to upstream and downstream by 2 Kb to represent the protein-coding region with default parameters. GeneWise software was used to predict gene structure contained in each protein-coding region. For each gene locus, the longest coding region and/or highest genewise score was retained. In RNAseq-based method, the coding sequences defined by transcripts was aligned against the genome by BLAT46 (v34, identity > 90%, coverage > 90%), thereby defining the splicing orientation of coding region. Then, PASA software was used to link the spliced alignments with default parameters. The EvidenceModeler47 (EVM, ver. 1.1) software was further used to integrate data derived from the three methods into an EVM-derived gene set with default parameters, the weight of de novo, homolog and complementary DNA (cDNA) are 1, 5, and 10. Finally, 26,838 and 30,238 protein-coding gene models were annotated in feather star and green sea urchin genome, respectively (Supplementary Table 18).
Annotation of gene function, non-protein-coding genes
InterProScan (v4.8) was used to screen these genes’ protein sequences against five databases (including: Pfam, release 27.0, prints, release 42.0, prosite, release 20.97, ProDom, 2006.1, and smart, release 6.2) to determine the InterPro and GO number of those predicted protein-coding genes. In addition, KEGG, COG, NR, Uniprot/SwissProt, and UniProt/TrEMBL databases were searched for homology-based functions (Supplementary Tables 19 and 20) using blastp (v2.2.26) with e-value (1e-5). For non-coding genes, tRNAscan-SE 53 (v1.3) software for eukaryotes was used for tRNA annotation in the genomic assembly with default parameters. Ribosomal RNA (rRNA) annotation was based on homology information of invertebrate rRNA collections using BLASTN (v2.2.26) with e-value set as 1e-5. The small nuclear RNA (snRNA) and microRNA (miRNA) were predicted by INFERNAL software (v0.81) against the Rfam database (Release 9.1) with default parameters. The statistical results are shown in Supplementary Tables 21 and 22.
Potential functions of protein-coding genes were predicted using InterProScan48 (v4.5), against five databases (Pfam, release 27.0, PRINTS, release 42.0, PROSITE, release 20.97, ProDom, 2006.1, and SMART, release 6.2). In addition, KEGG, COG, NR, Uniprot/SwissProt and UniProt/TrEMBL databases were searched for homology-based functions (Supplementary Tables 19 and 20). For non-coding genes, the tRNAscan-SE49 (v1.3) software for eukaryote was used for tRNA annotation in the genomic assembly. rRNA annotation was based on homology information of invertebrate rRNA collections using BLASTN (v2.2.26) with e-value (1e-5). The snRNA and miRNA were predicted by INFERNAL software (v0.81) against the Rfam database (Release 9.1). The statistical results are shown in Supplementary Tables 21 and 22.
Gene family analysis
orthoMCL: orthoMCL50 was used to find ortholog genes and/or gene families (ortholog groups) among different species. Amphioxus (Branchiostoma floridae), zebrafish (Danio rerio), ciona (Ciona intestinalis), Drosophila (Drosophila melanogaster), chicken (Gallus gallus), acorn worm (Saccoglossus kowalevskii), green sea urchin (Lytechinus variegatus [Lv]), purple sea urchin (Strongylocentrotus purpuratus [Sp]), medaka (Oryzias latipes), mouse (Mus musculus), brittle star (Ophiothrix spiculata), feather star (Anneissia japonica [Anj]), lamprey (Petromyzon marinus), sea cucumber (Apostichopus japonicus [Apj]), sea star (Acanthaster planci), frog (Xenopus laevis), turtle (Pelodiscus sinensis) gene set were prepared and used here. Gene families and ortholog genes identified by this OrthoMCL is shown in Supplementary Figs. 5 and 6. For ortholog groups identified among echinoderms were 15618 for Lv-Sp-Apj-Anj, 14758 for Lv-Apj-Anj, 15035 for Lv-Sp-Apj, 14231 for Lv-Sp and 13649 for Lv-Anj.
Reciprocal best blast hit (RBBH), 1:1 orthologs: We also analyzed the ortholog genes by RBBH method. We first selected feather star as the reference species, and aligned the protein sequences in all other 16 species to feather star gene set and vice versa by blast. Second, the aligned results were filtered by e-value (1e-5) and retained only the reciprocal best blast hit for each gene-gene pairs. Third, orthologous gene pairs in all of the 16 species were extracted. Finally, we identified 1196 ortholog genes among these 17 species.
Phylogenetic tree construction and divergence time
Molecular phylogenetic analysis: 1196 RBBH ortholog genes (1,447,456 aa) in each species were combined into a super-gene in the same gene order, followed by phylogenetic analysis using RaxML51 (with PROTGAMMAAUTO model, Drosophila melanogaster was used as the outgroup species) through these super-genes (Fig. 1b and Supplementary Table 25). Both of the reconstructed phylogenetic trees robustly showed three clusters, including echinoderms, acorm worm, and chordates. Among them, feather star was the earliest diverging species in echinoderms, brittle star and sea star form one branch, sea urchin and sea cucumber form another branch.
Divergence time estimation: To estimate the divergence time, the super-genes prepared above were analyzed by MCMCtree software, together with several calibration points downloaded from TimeTree website (http://www.timetree.orgs) (Supplementary Fig. 7).
Relative evolutionary rates of species
To determine the relatively evolutionary rates of echinoderm species, the super-genes, which we produced from 1196 RBBH orthologs were used. LINTRE software and RRT (Tajima’s relative rate test) analysis were employed, and Drosophila was used as an outgroup to determine the root of the whole tree (Supplementary Fig. 8 and Supplementary Tables 26–28. In addition to the LINTRE analysis, R-package “APE” was also used to deduce robust conclusion (Supplementary Fig. 9).
Expansion and contraction of gene families
To identify expanded and contracted gene families in the common ancestor of echinoderms, the gene family result generated from OrthoMCL were used and analyzed by CAFE software (Supplementary Fig. 11). Profiles of GO terms, protein domains and KEGG pathways of these expanded and contracted genes are shown in Extended data 1 (Extended_data1.xlsx).
Domains lost in echinoderms
Domains found in any of the chordate species, but not found in any of the the echinoderm species were defined as domains lost in echinoderm lineage. Six echinoderm species (Apostichopus japonicus, Lytechinus variegatus, Acanthaster planci, Ophiothrix spiculata, Anneissia japonica, and Strongylocentrotus purpuratus) and nine chordate species (Mus musculus, Branchiostoma floridae, Ciona intestinalis, Petromyzon marinus, Oryzias latipes, Gallus gallus, Xenopus laevis, Pelodiscus sinensis, and Danio rerio) were blasted (>50% identity and >30% align ratio) to the acorn worm (Saccoglossus kowalevskii) protein gene set and searched for potential domains lost in echinoderms. Seven-hundred forty-seven genes were identified to be the lost genes in echinoderms. Among these genes, six genes were not found in any of the nine chordate species, but found in acorn worm. These genes were enriched with GO terms of biosynthetic process, metabolism process, and the establishment of localization.
Hox cluster analysis
Cloning of Hox genes: To further confirm sequences of Hox genes in the feather star, a total of nine hox genes had been cloned from Anneissia japonica using RT-PCR (Tsurugaya et al., in preparation).
Preparation of A. japonica BAC library: We constructed BAC library, using genomic DNA prepared from the male gonadal pinnules that contained testes. The DNA was partially digested with the restriction enzyme MboI, size-fractionated, and cloned into the vector pCCBAC1(EPICENTER). The bacterial strain DH10B T1 phage resistant (Invitrogen) was used for transfecting the BACs for constructing the library. Single clones were picked into 384-well plates and preserved. Two batches of libraries were produced, which were named Oj1 (average insert size ~100 kb, 35,712 clones) and Oj2 (average insert size ~78 kb, 45,977 clones).
Screening and cloning of BAC clones containing hox genes: Using the cDNA fragments of nine hox genes (hox1, hox2, hox4, hox5, hox7, hox8, hox9/10, hox11/13a, and hox11/13c. Tsurugaya et al., in preparation), we screened the BAC library of A. japonica for the clones that contained Hox genes and their neighboring regions. This screening yielded 23 clones in total, which, however, were not contiguous but separated into four groups.
FISH analysis: Probes for FISH were derived from clones out of the A. japonica BAC library. BAC clones used for FISH were Oj1–26E10 (containing hox1), Oj2–17D15 (hox2), Oj2–75D03 (hox4 and hox5), Oj2–78N14 (hox7 and hox8), Oj1–50I03 (hox8 and hox9/10), and Oj2–102A05 (hox11/13c). BAC clone DNAs were isolated using Qiagen Plasmid Midi Kit (Qiagen) and labeled with biotin or digoxigenin by using Nick Translation Kit (Roche). Hybridization mix was prepared as described previously (3). Two color-chromosomal FISH was carried out as described previously (1, 2) with the following modifications. Blastula or early gastrula stage embryos were treated with 0.08% colchicine (Sigma) in sea water for 30 min. Embryos were fixed in methanol glacial acetic acid (3:1) fixative at 4 °C overnight, then transferred to 100% ethanol, and stored at –20 °C. To prepare metaphase spreads, 80 µL of 60% acetic acid was added to a microfuge tube containing 50–100 embryos. Three minutes later, embryos were dropped onto a prewarmed (48 °C) slide glass, and left until dry (about 30 min). Before hybridization, the slides were treated with 0.5% pepsin (1:100, Wako) in 0.01 N HCl for 3 min, and washed in phosphate-buffered saline (PBS) three times. Then the slides were post-fixed in 1% paraformaldehyde in PBS at r.t. for 30 min, and washed in PBS twice. After dehydration, the air-dried slides were treated with acetone at r.t. for 10 min, and dried again. Following the denaturation of chromosomal DNA and dehydration, hybridization was carried out at 43 °C for 16 h. FISH images were taken using an Olympus BX60 microscope equipped with an Olympus DP70 camera.
Identification of clustered Hox genes: In scaffold 288292 (about 1.86 Mbp in length), hox1, hox2, hox3, hox4, hox5, hox6, hox7, hox8, hox9/10, and hox11/13a were identified. The ten Hox genes were aligned in the order, spanning about 480 kb in length, with the 3ʹend of hox1 about 392 kb away from the end of the scaffold. In scaffold 287987 (about 96 kb), hox11/13b and hox11/13c were identified. To see whether the 12 Hox genes form a single cluster, we carried out two color-chromosomal FISH, using the BAC clones (described above) as probes. The FISH analysis revealed that the eight genes contained in the BAC clones were in close vicinity to one another on a single chromosome (comprising of two sister chromatids). However, the gene order or relative positions of the two scaffolds on the chromosome could not be clarified, leaving four possible gene orders of 12 Hox genes undetermined. Thus, it is suggested that 12 Hox genes are present on a single chromosome, forming two subclusters separated by at least 400 kb in the genome of Anneissia japonica10, hox11/13d and hox11/13e, in another scaffolds 2266 and 6788, respectively. This suggests that the two genes are localized apart from the subcluster of ten Hox genes, which situation is consistent with the previous report showing that Hox11/13d and Hox11/13e do not reside in the Hox gene cluster in echinoderm genomes10.
Embryo collection and RNA extraction
Lytechinus variegatus: Adult green sea urchins were originally obtained from Reeftopia in Florida (FL) or from the Duke Marine lab in Beaufort NC. L. variegatus total RNA was prepared from wild type embryos per timepoint using TRIzol (Invitrogen) and DNase treatment. RNA quantitation and integrity were determined using a Qubit® 2.0 Fluorometer (Life Technologies) and a 2100 Bioanalyzer (Agilent Technologies). Total RNA was subjected to three iterations of polyA selection using Dynabeads (Life Technologies) prior to cDNA synthesis. Following stages were collected for RNA extraction and fixation; 2 cell (1 h post fertilization), 60 cell (2.5 hpf), EB (Early Blastula, 4 hpf), HB (Hatched Blastula, 7 hpf), TVP (Thickened Vegetal Plate, 10 hpf), MB (Mesenchyme Blastula, 12 hpf), EG (Early Gastrula, 13 hpf), MG (Mid Gastrula, 15 hpf), LG (Late Gastrula,18 hpf), EP (Early Pluteus, 36 hpf), LP (Late Pluteus, 48 hpf), 7 wpf (7 weeks post fertilization), 8 wpf (8 weeks post fertilization), 1 day post metamorphosis, 1 week post metamorphosis, and adult. In addition, RNA from larval region of 8 weeks post fertilization (8 wpf Larva), and rudiment region of 8 weeks post fertilization (8 wpf Rudiment) were also extracted by dissecting the 8 wpf embryo. Results based on analyses with RNAseq data from two cell to Late pluteus were published52. Two independent biological samples were prepared for all the sampled stages.
Apostichopus japonicus: Embryos of fertilized eggs, 4 cell (2 h post fertilization (hpf)), morula (6 hpf), blastula (14 hpf), gastrula (29 hpf), late gastrula (34 hpf), early auricularia larva (48 hpf), mid-auricularia larva (69 hpf), late auricularia larva (15 days post fertilization (dpf)), metamorphosis 1–4 (17–19 dpf), doliolaria larva (19 dpf), pentactula larva (27 dpf), and juvenile (51 dpf) stage were collected and used for this study, as previously described23. Three independent biological samples were prepared for all the sampled stages.
Anneissia japonica: Adult Anneissia japonica (previously called as Oxycomanthus japonicus, see Summers et al.53 for the nomenclature) were collected from rocky substrate of about 10 m depth at Koajiro, Sagami Bay, and kept in the sea until the day of spawning. Spawning check was carried out at every neap tide days during October and November, 2015. Spawning was observed in the evening of 20th and 21st of October, 2015, and seven females spawned in total. The obtained eggs were very fragile and surrounded by mucus. Small amounts of the spawned unfertilized eggs were separated in 1.5 mL tubes (100 μL each) for RNA extraction and fixation. The rest of the eggs were inseminated immediately by diluting concentrated sperm, which were directly collected from genital pinnules. The fertilized eggs were washed with filtered sea water several times to remove the mucous, and separated in the filtered sea water in plastic vessels for culture. The culture was done at room temperature (about 10–20 °C). Following stages were collected for RNA extraction and fixation (Supplementary Fig. 15); 2 cells (1.5 h post fertilization), 8 cells (2.5 hpf), 32 cells (3.5 hpf), gastrula (8 hpf), hatching stage (17 hpf), early doliolaria (24 hpf), mid-late doliolaria (36 hpf), attachment stage (3–4 days pf), early cystidean (4–7 days pf), late cystidean (7–9 days pf), early pentacrinoid (3 weeks pf), late pentacrinoid (1.5 months pf), juvenile (2.5 months pf), arm branching stage (6–7 months pf), and adult (9 months pf). For the RNA extraction, more than 50 μL of specimens were diluted in the 10x volume of TRIzol reagent (Invitrogen). The tissue of the specimens were destructed by pipetting with a micro syringe or grinding with a pestle and mortar in the TRIzol reagent, and immediately stored in –80 °C. For the fixation, specimens were fixed with 4% paraformaldehyde in 0.5 M NaCl and 0.1 M 3-(N-morpholino) propanesulfonic acid (MOPS), pH 7.0 for several days at room temperature (about 22 °C). Fixed specimens were washed with 70% ethanol three times, and stored in 70% ethanol at –20 °C. Two independent biological samples were prepared for all the sampled stages.
RNA sequencing and gene expression data
After adjusting total RNA amounts between samples, non-stranded sequencing libraries (with the TruSeq protocol) were constructed and sequenced using the Illumina HiSeq 4000 platform. For the sea cucumber (A. japonicus) samples, Quartz-seq amplified libraries were made as previously described13. Qualities of raw reads were evaluated using FastQC program (http://www.bioinformatics.bbsrc.ac.uk/projects/fastqc/). Read length and single/paired information are as follows; L. variegatus (100 bp, paired-end), A. japonica (150 bp, paired-end), A. japonicus (100 bp, single-end). Adapter sequences of Quartz-Seq samples (Mm early stages 2-cell-blastocyst) were removed using the fastq-mcf program (https://code.google.com/p/ea-utils/wiki/FastqMcf) as previously described13. RNAseq data were then mapped to genomes of each species using HISAT2 program54 (ver. 2.05), and calculated relative expression levels by StringTie55 (ver. 1.3.5) with species-specific GTF files.
Apostichopus japonicus: For the gene expression levels of Japanese sea cucmber, genome and GTF files reported by Zhang et al.56 were used.
Strongylocentrotus purpuratus: Developmental transcriptomes of the purple sea urchin was obtained from SRA (Accession: PRJNA81157), sequenced by Tu et al.21,22. The dataset contained developmental stages of 0 hpf, 10 hpf, 18 hpf, 24 hpf, 30 hpf, 40 hpf, 48 hpf, 56 hpf, 64 hpf, 72 hpf, four arm larva, vestibular invagi, pentagonal disc, tube foot protrusion, post metamorphosis, young juvenile, adult.
Identification of conserved stages
Whole embryonic, comparative transcriptomic analysis was performed as previously described to find evolutionarily conserved developmental stages13. Relative expression levels (TPM) of ortholog groups (defined by orthomcl57) were calculated from the RNAseq data, and then compared their dissimilarities (expDists) among developmental stages of different species. In calculating dissimilarity (1 – Spearman) of ortholog-group-based whole-embryonic transcriptomes (expDists), phylogenetic relationship [Anj(Apj(Sp,Lv))] were taken into consideration to avoid unwanted bias arising from simple pair-wise comparisons58. By randomly picking-up one biological replicate sample for each developmental stage (in each species), 100 expression tables (100 biological replicate included expression table, or BRI-exp data) were created (method reported in Hu et al.13). We used this 100 BRI table to test statistical significance of changes in Ptop scores (Friedman test).
Whole-mount in situ hybridization
Digoxigenin (Dig) labeled riboprobe for pitx gene of A. japonica was prepared from PCR-amplified fragments (911 bp) using following primiers: 5ʹ-GAACGATTCGCTTCCGATGC-3ʹ (forward primer), 5ʹ-TGAGACCGGCGTATTGACAC-3ʹ (reverse primer). Whole-mount in situ hybridization (WISH) was conducted following the protocol for the planktonic larvae of a stalked crinoid Metacrinus rotundus59 with some modifications. Specimens were fixed with 4% paraformaldehyde (PFA) in 0.5 M NaCl and 0.1 M 3-(N-morpholino) propanesulfonic acid (MOPS), pH 7.0 for over 1 day, and stored at –20 °C in 70% ethanol. The fixed specimens were washed three times with PBST (1× phosphate-buffered saline with 0.1% Tween 20), treated with 0.2 µg/mL proteinase K in PBST at 37 °C for 20 min, re-fixed with 4% PFA at 4 °C for 30 min, washed three times with PBST, and then incubated in hybridization buffer (50% formamide, 5× SSC, 100 µg/mL yeast RNA, 50 µg/mL heparin, 1% Tween 20) at 55 °C for 4–6 h. Hybridization was carried out with 0.2 µg/mL probes in the hybridization buffer at 55 °C for 5 days. The protocol after hybridization was as previously described59. WISH finished samples were observed and photographed under the BX-51 optical microscope (Olympus).
Proteomic analysis
Proteins were isolated from adult feather skeleton and analyzed as previously described36. All organic material was removed from the skeleton by extensive washing with sodium hypochlorite followed by guanidine isothiocyanate. The skeleton was demineralized with acetic acid followed by dialysis. Both soluble and insoluble protein fractions were analyzed. Proteins were separated by sodium dodecyl sulfate–polyacrylamide gel electrophoresis. Each lane was excised into 20 equal sized segments and processed. In-gel digestion with trypsin was performed on each fraction, followed by analysis by nano Liquid chromatography–mass spectrometry (LC-MS/MS) with a Waters nanoAcquity high-performance liquid chromatography system interfaced to a ThermoFisher Q Exactive hybrid quadrupole-orbitrap mass spectrometer. The mass spectrometer was operated in a data-dependent mode. Data were used to search predicted peptides from the A. japonica genome using Mascot and then parsed into the Scaffold algorithm for validation and filtering, using a 95% protein identification score with at least two peptides per protein.
Statistics and reproducibility
Alpha levels of 0.05 were regarded as statistically significant throughout the study, unless otherwise specified. Experiments were repeated multiple times to confirm the reproducibility of the data. See details for individual experiments in the “Methods” sections above.
Reporting summary
Further information on research design is available in the Nature Research Reporting Summary linked to this article.
Data availability
Genomic sequence data and assembled genomes for the following species are available through the NCBI database at the indicated BioProject accession IDs: Brittle star genome (PRJNA182997), feather star genome (PRJNA553656), and green sea urchin genome (PRJNA553643). RNAseq data are available for the following species at the indicated BioProject accession IDs: green sea urchin RNAseq data (PRJNA554218), feather star RNAseq data (PRJNA553591), and Japanese sea cucumber RNAseq data (PRJNA553613). Cloned sequences of Hox genes of the feather star (hox1 LC462021, hox2 LC462022, hox4 LC462023, hox5 LC462024, hox7 LC462025, hox8 LC462026, hox9/10 LC462027, hox11/13a LC462028, hox11/13c LC462029) are also available through the NCBI database at the indicated nucleotide accession IDs. Assembled genomes and gene sets can also be accessed through the DRYAD database60 at https://doi.org/10.5061/dryad.rbnzs7h7n. Proteomic data are available via the ProteomeXchange with identifier PXD019526. Source data for Figs. 2a and 3b can be found in Supplementary Data 1 and Supplementary Data 2.
Code availability
No custom or proprietary software was used in the analysis. Versions and parameters for each software package used are described in the reporting summary and elsewhere in the “Methods.”


.4fn9eu502dm0.jpg)